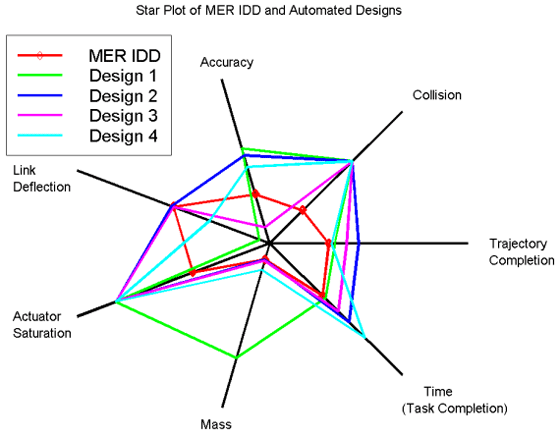
Star plots are used to graph all sorts of data that are relative to the same behavior of all variables in a multivariate data set. Star plots are created with "spokes" and each spoke has represents a different data. With all of the interconnecting spokes the chart looks like a start hinse the name "star plot."

No comments:
Post a Comment