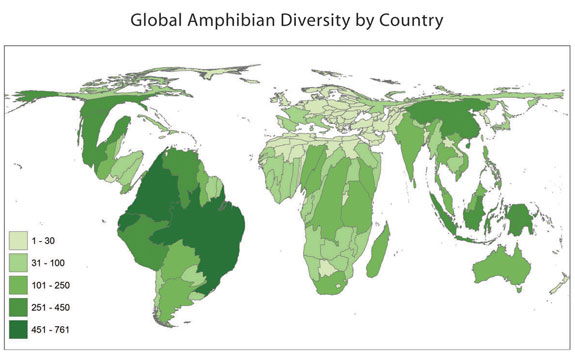
 This is a cartogram of global amphibian diversity around the world. This is an illustration ofamphibian diversity and density. As the green color display darker, that shows that there are more amphibian in that particular area. Cartograms can be used to show a number of things across the world such as animal populations, emissions, census information, colleges and just about any thing.
Map found at: http://www.amphibiaweb.org/amphibian/cartograms/cart_global_diversity.jpg

No comments:
Post a Comment